
Bollinger Bands is the range where the underlying asset remains at specific probability. Bollinger Bands is defined by moving average (SMA or EMA) in a specific period[X] and standard deviation in the same period[X]. In case of the range "(Moving Average) +/- 2 x (St.Dev)", probability of the price in the range is 95.45%. (With some theoretical preconditions)
Bollinger Bands is represented as Bollinger Bands[X, Y] with the parameters X (calculation period) and Y (multiple number to St.Dev). For example, in 1 min scale, calculation period last 240 mins and the multiple number 3, it will be represented as Bollinger Bands[240, 3].
In order to obtain Bollinger Bands, define
1) Time scale for the historical data
2) Calculation period[X] for moving average and standard deviation.
3) Multiple number[Y] to the standard deviation.
[Calculation sample]
1) 1 min scale
2) Last 240 data points (Last 240 mins)
3) The multiple number is 3
| Bollinger Bands[240, 3] is | [ (Moving Average[240]) - 3 x (St.Dev[240]), (Moving Average[240]) + 3 x (St.Dev[240]) ] |
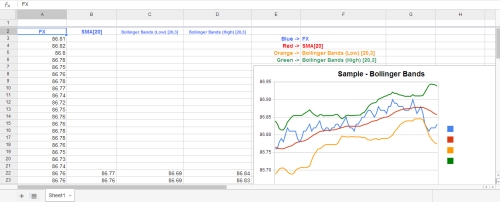
Bollinger Bands calculation sample on spread sheet.
 Download Forex Signal by QROSS X |
© Copyright K 458 All Rights Reserved.