
EMA is the exponential average in a specific period. EMA also indicates trend of the underlying asset but prioritize newer data as against SMA. Newer data is more prioritized than older data in EMA, and it observes price trend more sensitive than SMA. EMA is utilized in MACD calculation.
EMA calculation is not as simple as SMA calculation. In the theory, all the historical data is taken into account for EMA calculation. Practically, the data is limited for a specific period. The other period[X] has to be defined, where the data has 86% of weight for EMA.
In order to obtain EMA, define
1) Time scale for the historical data
2) Period limiting the historical data for EMA calculation.
3) Period[X] where the data has 86% of weight for EMA.
[Calculation sample]
1) 1 min scale
2) Last 1200 data points (Last 1200 mins)
3) Last 240 data points (Last 240 mins)
| EMA[240] = | A x {(Spot price) + (Price at 1 min ago) x (1-A) + (Price at 2 mins ago) x (1-A)^2 |
| + ... + (Price at 1199 mins ago) x (1-A)^1199} | |
| A = 2 / (240 + 1) "240" is defined at 3). | |
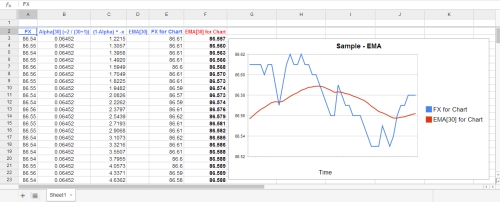
EMA calculation sample on spread sheet.
 Download Forex Signal by QROSS X |
© Copyright K 458 All Rights Reserved.