
SMA is the simple average in a specific period[X]. SMA indicates trend of the underlying asset.
In order to obtain SMA, define
1) Time scale for the historical data
2) Number of data for calculation
[Calculation sample]
1) 1 min scale
2) Last 240 data points (Last 240 mins)
| SMA[240] = | (Spot price) + (Price at 1 min ago) + (Price at 2 mins ago) + ... + (Price at 239 mins ago) |
| 240 | |
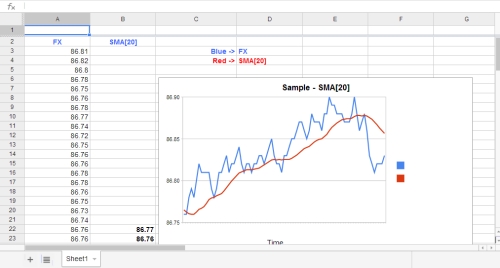
SMA calculation sample on spread sheet.
 Download Forex Signal by QROSS X |
© Copyright K 458 All Rights Reserved.