
MACD is the difference between two moving average, which subtracts long termed EMA from short termed EMA. MACD implies upward trend while MACD is positive and downward trend while MACD is negative.
In chart analysis, MACD is often observed with MACD signal which is moving average of MACD itself.
In order to obtain MACD, define
1) Time scale for the historical data
2) Short term period[X]
3) Long term period[Y]
(X < Y)
[Calculation sample]
1) 1 min scale
2) Last 120 mins (Last 120 data points)
3) Last 240 mins (Last 240 data points)
| MACD[120, 240] = | EMA[120] - EMA[240] |
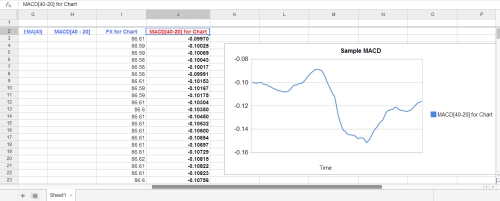
MACD calculation sample on spread sheet.
 Download Forex Signal by QROSS X |
© Copyright K 458 All Rights Reserved.