Stochastics K, D and Slow D
Stochastics indicates relative value of the underlying asset to the highest value and lowest value in a specific period. Stochastics provides view of the underlying asset overvalued or undervalued.
Most of the cases, stochastics stay from 0% to 100%, and the value closer to 0% implies the price is going down and the value closer to 100% implies the price is going up.
Stochastics consist of 3 lines, which are K, D and Slow D. (K) is the most sensitive to spot price moving, (D) is the 2nd sensitive and (Slow D) is following them.
Stochastics calculation formula
In order to obtain Stochastics (K, D and Slow D), define
1) Time scale for the historical data
2) Observation period for maximum price and minimum price
3) Calculation period for line D
4) Calculation period for line Slow D
[Calculation sample]
1) 1 min scale
2) Last 900 mins (Last 900 data points)
3) Last 600 mins (Last 600 data points)
4) Last 500 mins (Last 500 data points)
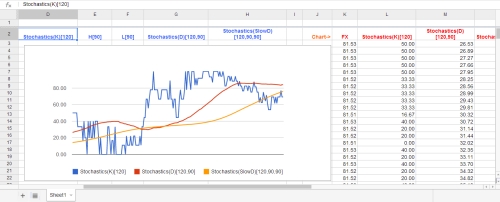
Stochastics calculation sample on spread sheet.
 Back to learning index