
RSI indicates the underlying asset is overvalued or undervalued. Maximum RSI at 100% and Minimum RSI at 0%.Greater RSI implies underlying asset value has been going up. Less RSI implies underlying asset value has been going down.
In order to obtain RSI, define
1) Time scale for the historical data
2) Number of data for calculation
[Calculation sample]
1) 1 min scale
2) Last 120 data points (Last 120 mins)
| RSI[120] = | (Sum of increased value for every 1 min) |
| ((Sum of increased value for every 1 min) + (Sum of decreased value for every 1 min)) | |
| (Summation in last 120 mins.) | |
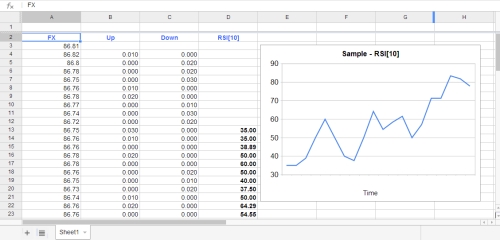
RSI calculation sample on spread sheet.
 Download Forex Signal by QROSS X |
© Copyright K 458 All Rights Reserved.